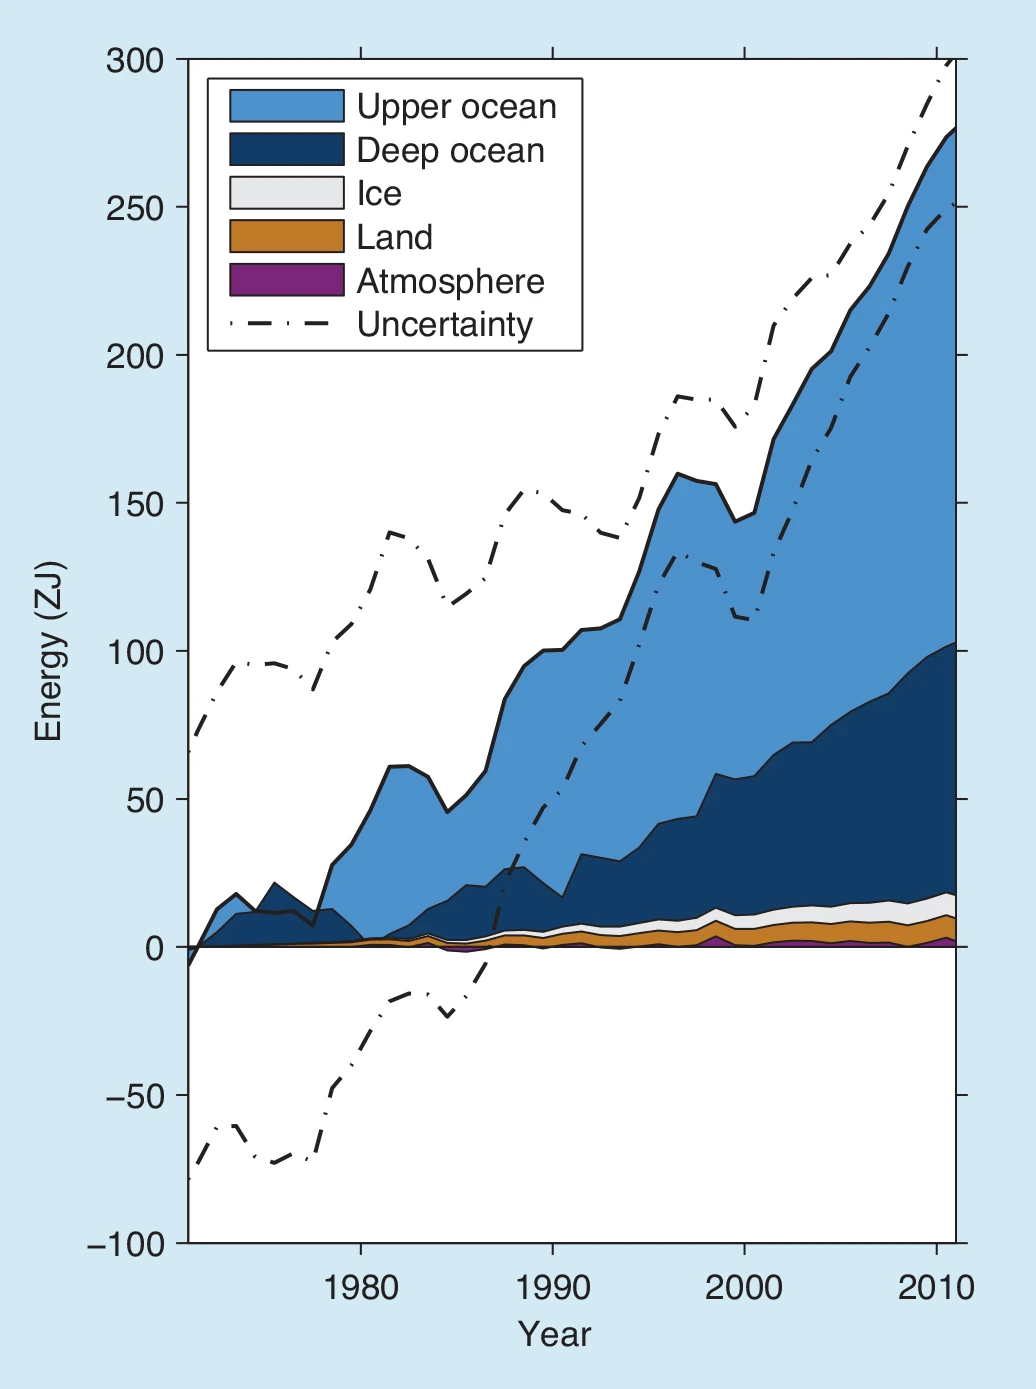
Box 3.1 Figure 1 Plot of energy accumulation in ZJ (1 ZJ = 1021 J) within distinct components of the Earth’s climate system relative to 1971 and from 1971 to 2010 unless otherwise indicated. See text for data sources. Ocean warming (heat content change) dominates, with the upper ocean (light blue, above 700 m) contributing more than the mid-depth and deep ocean (dark blue, below 700 m; including below 2000 m estimates starting from 1992). Ice melt (light grey; for glaciers and ice caps, Greenland and Antarctic ice sheet estimates starting from 1992, and Arctic sea ice estimate from 1979 to 2008); continental (land) warming (orange); and atmospheric warming (purple; estimate starting from 1979) make smaller contributions. Uncertainty in the ocean estimate also dominates the total uncertainty (dot-dashed lines about the error from all five components at 90% confidence intervals).
The global atmospheric energy change inventory accounting for specific heating and water evaporation is estimated by combining satellite estimates for temperature anomalies in the lower troposphere (Mears and Wentz, 2009a; updated to version 3.3) from 70°S to 82.5°N and the lower stratosphere (Mears and Wentz, 2009b; updated to version 3.3) from 82.5°S to 82.5°N weighted by the ratio of the portions of atmospheric mass they sample (0.87 and 0.13, respectively). These temperature anomalies are converted to energy changes using a total atmospheric mass of 5.14 × 10¹⁸ kg, a mean total water vapor mass of 12.7 × 10^15 kg (Trenberth and Smith, 2005), a heat capacity of 1 J g–1 °C–1, a latent heat of vaporization of 2.464 J kg–1 and a fractional increase of integrated water vapor content of 0.075 °C–1 (Held and Soden, 2006). Smaller changes in potential and kinetic energy are considered negligible. Standard deviations for each year of data are used for uncertainties, and the time series starts in 1979. The warming trend from a linear fit from 1979 to 2010 amounts to 2 TW (1 TW = 10^12 watts).
The global average rate of continental warming and its uncertainty has been estimated from borehole temperature profiles from 1500 to 2000 at 50-year intervals (Beltrami et al., 2002). The 1950–2000 estimate of land warming, 6 TW, is extended into the first decade of the 21st century, although that extrapolation is almost certainly an underestimate of the energy absorbed, as land surface air temperatures for years since 2000 are some of the warmest on record (Section 2.4.1).
All annual ice melt rates (for glaciers and ice-caps, ice sheets and sea ice from Chapter 4) are converted into energy change using a heat of fusion (334 × 10^3 J kg–1) and density (920 kg m–3) for freshwater ice. The heat of fusion and density of ice may vary, but only slightly among the different ice types, and warming the ice from sub-freezing temperatures requires much less energy than that to melt it, so these second-order contributions are neglected here. The linear trend of energy storage from 1971 to 2010 is 7 TW.
For the oceans, an estimate of global upper (0 to 700 m depth) ocean heat content change using ocean statistics to extrapolate to sparsely sampled regions and estimate uncertainties (Domingues et al., 2008) is used (see Section 3.2), with a linear trend from 1971 to 2010 of 137 TW. For the ocean from 700 to 2000 m, annual 5-year running mean estimates are used from 1970 to 2009 and annual estimates for 2010–2011 (Levitus et al., 2012). For the ocean from 2000 m to bottom, a uniform rate of energy gain of 35 [6 to 61] TW from warming rates centred on 1992–2005 (Purkey and Johnson, 2010) is applied from 1992 to 2011, with no warming below 2000 m assumed prior to 1992. Their 5 to 95% uncertainty estimate may be too small, as it assumes the usually sparse sampling in each deep ocean basin analysed is representative of the mean trend in that basin. The linear trend for heating the ocean below 700 m is 62 TW for 1971–2010.
It is virtually certain that the Earth has gained substantial energy from 1971 to 2010 — the estimated increase in energy inventory between 1971 and 2010 is 274 [196 to 351] ZJ (1 ZJ = 1021 J), with a rate of 213 TW from a linear fit to the annual values over that time period (Box 3.1, Figure 1). An energy gain of 274 ZJ is equivalent to a heating rate of 0.42 W m-2 applied continuously over the surface area of the earth (5.10 × 10¹⁴ m2). Ocean warming dominates the total energy change inventory, accounting for roughly 93% on average from 1971 to 2010 (high confidence). The upper ocean (0-700 m) accounts for about 64% of the total energy change inventory. Melting ice (including Arctic sea ice, ice sheets and glaciers) accounts for 3% of the total, and warming of the continents 3%. Warming of the atmosphere makes up the remaining 1%. The 1971–2010 estimated rate of oceanic energy gain is 199 TW from a linear fit to data over that time period, implying a mean heat flux of 0.55 W m–2 across the global ocean surface area (3.60 × 10¹⁴ m2). The Earth’s net estimated energy increase from 1993 to 2010 is 163 [127 to 201] ZJ with a trend estimate of 275 TW. The ocean portion of the trend for 1993–2010 is 257 TW, equivalent to a mean heat flux into the ocean of 0.71 W m–2 over the global ocean surface area.