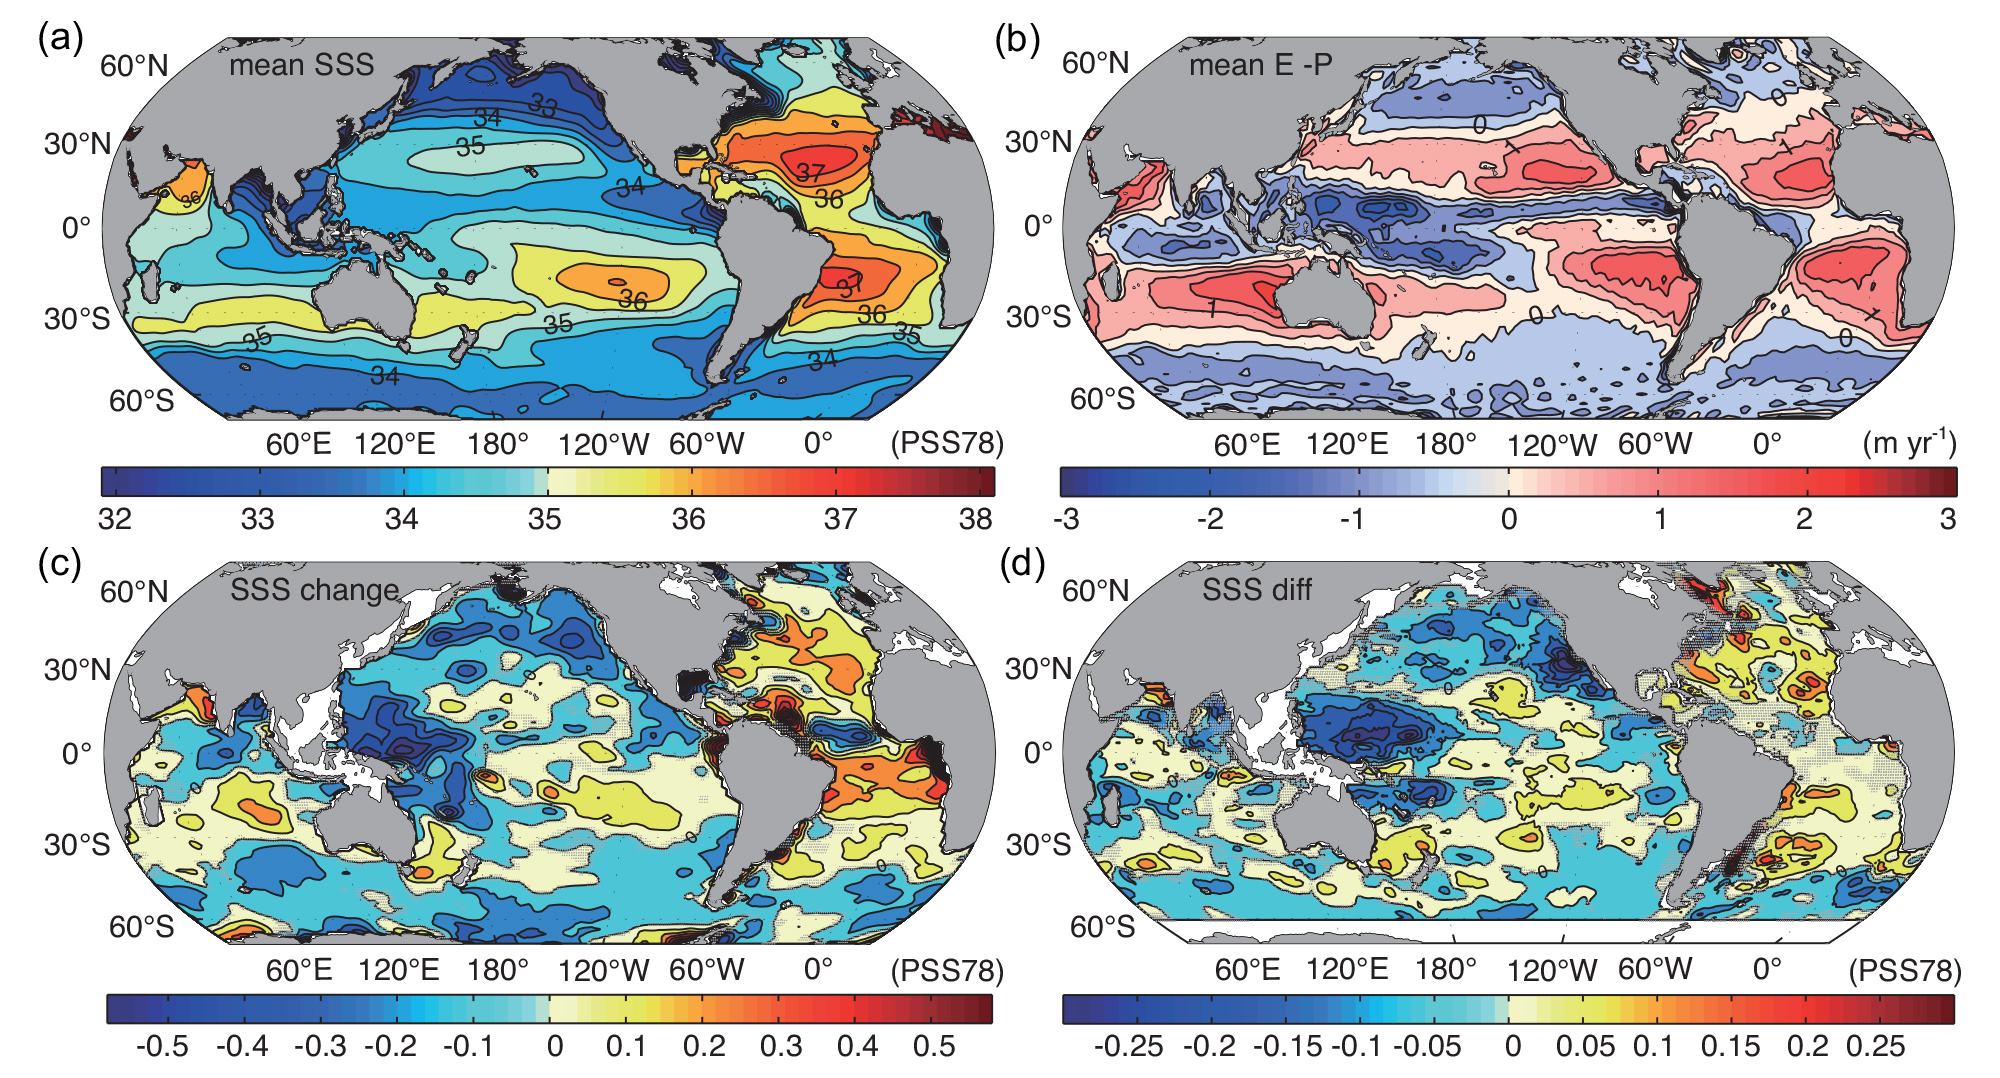
Figure 3.4 (a) The 1955–2005 climatological-mean sea surface salinity (World Ocean Atlas 2009 of Antonov et al., 2010) colour contoured at 0.5 PSS78 intervals (black lines). (b) Annual mean evaporation–precipitation averaged over the period 1950–2000 (NCEP) colour contoured at 0.5 m yr –1 intervals (black lines). (c) The 58-year (2008 minus 1950) sea surface salinity change derived from the linear trend (PSS78), with seasonal and El Niño-Southern Oscillation (ENSO) signals removed (Durack and Wijffels, 2010) colour con- toured at 0.116 PSS78 intervals (black lines). (d) The 30-year (2003–2007 average centred at 2005, minus the 1960–1989 average, centred at 1975) sea surface salinity difference (PSS78) (Hosoda et al., 2009) colour contoured at 0.06 PSS78 intervals (black lines). Contour intervals in (c) and (d) are chosen so that the trends can be easily compared, given the different time intervals in the two analyses. White areas in (c) to (d) are marginal seas where the calculations are not carried out. Regions where the change is not significant at the 99% confidence level are stippled in grey.
The ocean plays a pivotal role in the global water cycle: about 85% of the evaporation and 77% of the precipitation occurs over the ocean (Schmitt, 2008). The horizontal salinity distribution of the upper ocean largely reflects this exchange of freshwater, with high surface salinity generally found in regions where evaporation exceeds precipitation, and low salinity found in regions of excess precipitation and runoff (Figure 3.4a,b). Ocean circulation also affects the regional distribution of surface salinity. The subduction (Section 3.5) of surface waters transfers the surface salinity signal into the ocean interior, so that subsurface salinity distributions are also linked to patterns of evaporation, precipitation and continental run-off at the sea surface. Melting and freezing of ice (both sea ice and glacial ice) also influence ocean salinity.
Regional patterns and amplitudes of atmospheric moisture transport could change in a warmer climate, because warm air can contain more moisture (FAQ 3.2). The water vapour content of the troposphere likely has increased since the 1970s, at a rate consistent with the observed warming (Sections 2.4.4, 2.5.5 and 2.5.6).
It has not been possible to detect robust trends in regional precipitation and evaporation over the ocean because observations over the ocean are sparse and uncertain (Section 3.4.2). Ocean salinity, on the other hand, naturally integrates the small difference between these two terms and has the potential to act as a rain gauge for precipitation minus evaporation over the ocean (e.g., Lewis and Fofonoff, 1979; Schmitt, 2008; Yu, 2011; Pierce et al., 2012; Terray et al., 2012; Section 10.4). Diagnosis and understanding of ocean salinity trends is also important because salinity changes, like temperature changes, affect circulation and stratification, and therefore the ocean’s capacity to store heat and carbon as well as to change biological productivity. Salinity changes also contribute to regional sea level change (Steele and Ermold, 2007).
In AR4, surface and subsurface salinity changes consistent with a warmer climate were highlighted, based on linear trends for the period between 1955 and 1998 in the historical global salinity data set (Boyer et al., 2005) as well as on more regional studies. In the early few decades the salinity data distribution was good in the NH, especially the North Atlantic, but the coverage was poor in some regions such as the central South Pacific, central Indian and polar oceans (Appendix 3.A). However, Argo provides much more even spatial and temporal coverage in the 2000s. These additional observations, improvements in the availability and quality of historical data and new analysis approaches now allow a more complete assessment of changes in salinity. ‘Salinity’ refers to the weight of dissolved salts in a kilogram of seawater. Because the total amount of salt in the ocean does not change, the salinity of seawater can be changed only by addition or removal of fresh water. All salinity values quoted in the chapter are expressed on the Practical Salinity Scale 1978 (PSS78) (Lewis and Fofonoff, 1979).