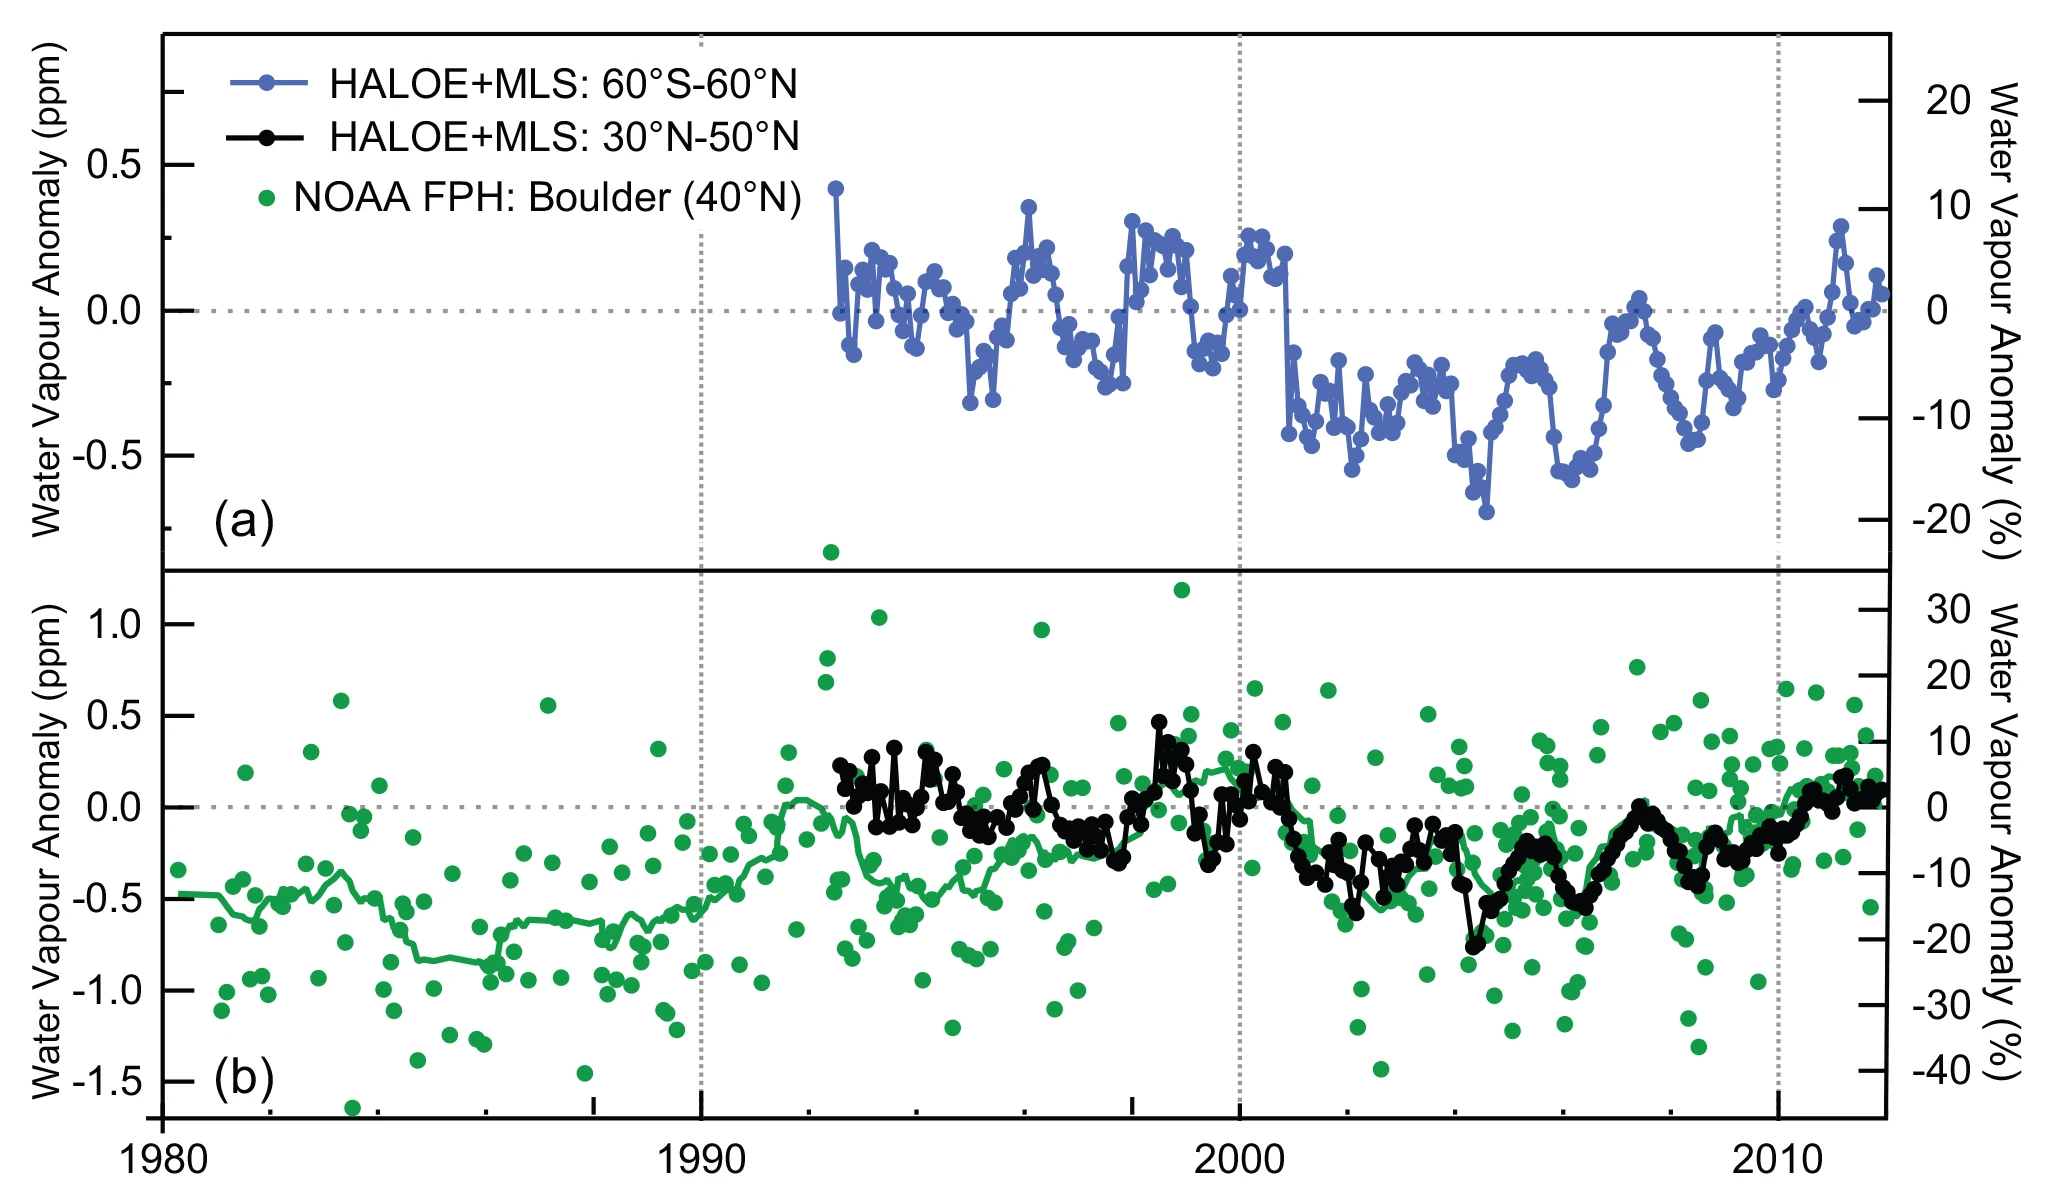
Water vapour anomalies in the lower stratosphere (~16 to 19 km) from satellite sensors and in situ measurements normalized to 2000–2011. (a) Monthly mean water vapour anomalies at 83 hPa for 60°S to 60°N (blue) determined from HALOE and MLS satellite sensors. (b) Approximately monthly balloon-borne measurements of stratospheric water vapour from Boulder, Colorado at 40°N (green dots; green curve is 15-point running mean) averaged over 16 to 18 km and monthly means as in (a), but averaged over 30°N to 50°N (black)
Stratospheric H2O vapour has an important role in the Earth’s radiative balance and in stratospheric chemistry. Increased stratospheric H2O vapour causes the troposphere to warm and the stratosphere to cool (Manabe and Strickler, 1964; Solomon et al., 2010), and also causes increased rates of stratospheric O3 loss (Stenke and Grewe, 2005). Water vapour enters the stratosphere through the cold tropical tropopause. As moisture-rich air masses are transported through this region, most water vapour condenses resulting in extremely dry lower stratospheric air. Because tropopause temperature varies seasonally, so does H2O abundance there. Other contributions include oxidation of methane within the stratosphere, and possibly direct injection of H2O vapour in overshooting deep convection (Schiller et al., 2009). AR4 reported that stratospheric H2O vapour showed significant long-term variability and an upward trend over the last half of the 20th century, but no net increase since 1996. This updated assessment finds large interannual variations that have been observed by independent measurement techniques, but no significant net changes since 1996.
The longest continuous time series of stratospheric water vapour abundance is from in situ measurements made with frost point hygrometers starting in 1980 over Boulder, USA (40°N, 105°W) (Scherer et al., 2008), with values ranging from 3.5 to 5.5 ppm, depending on altitude. These observations have been complemented by long-term global satellite observations from SAGE II (1984–2005; Stratospheric Aerosol and Gas Experiment II (Chu et al., 1989)), HALOE (1991–2005; HALogen Occultation Experiment (Russell et al., 1993)), Aura MLS (2004–present; Microwave Limb Sounder (Read et al., 2007)) and Envisat MIPAS (2002-2012; Michelson Interferometer for Passive Atmospheric Sounding (Milz et al., 2005; von Clarmann et al., 2009)). Discrepancies in water vapour mixing ratios from these different instruments can be attributed to differences in the vertical resolution of measurements, along with other factors. For example, offsets of up to 0.5 ppm in lower stratospheric water vapour mixing ratios exist between the most current versions of HALOE (v19) and Aura MLS (v3.3) retrievals during their 16-month period of overlap (2004 to 2005), although such biases can be removed to generate long-term records. Since AR4, new studies characterize the uncertainties in measurements from individual types of in situ H2O sensors (Vömel et al., 2007b; Vömel et al., 2007a; Weinstock et al., 2009), but discrepancies between different instruments (50 to 100% at H2O mixing ratios less than 10 ppm), particularly for high-altitude measurements from aircraft, remain largely unexplained.
Observed anomalies in stratospheric H2O from the near-global combined HALOE+MLS record (1992–2011) (Figure 2.5) include effects linked to the stratospheric quasi-biennial oscillation (QBO) influence on tropopause temperatures, plus a step-like drop after 2001 (noted in AR4), and an increasing trend since 2005. Variability during 2001–2011 was large yet there was only a small net change from 1992 through 2011. These interannual water vapour variations for the satellite record are closely linked to observed changes in tropical tropopause temperatures (Fueglistaler and Haynes, 2005; Randel et al., 2006; Rosenlof and Reid, 2008; Randel, 2010), providing reasonable understanding of observed changes. The longer record of Boulder balloon measurements (since 1980) has been updated and reanalyzed (Scherer et al., 2008; Hurst et al., 2011), showing deca dal-scale variability and a long-term stratospheric (16 to 26 km) increase of 1.0 ± 0.2 ppm for 1980–2010. Agreement between interannual changes inferred from the Boulder and HALOE+MLS data is good for the period since 1998 but was poor during 1992–1996. About 30% of the positive trend during 1980–2010 determined from frost point hygrometer data (Fujiwara et al., 2010; Hurst et al., 2011) can be explained by increased production of H2O from CH4 oxidation (Rohs et al., 2006), but the remainder cannot be explained by changes in tropical tropopause temperatures (Fueglistaler and Haynes, 2005) or other known factors.
In summary, near-global satellite measurements of stratospheric H2O show substantial variability for 1992–2011, with a step-like decrease after 2000 and increases since 2005. Because of this large variability and relatively short time series, confidence in long-term stratospheric H2O trends is low. There is good understanding of the relationship between the satellite-derived H2O variations and tropical tropopause temperature changes. Stratospheric H2O changes from temporally sparse balloon-borne observations at one location (Boulder, Colorado) are in good agreement with satellite observations from 1998 to the present, but discrepancies exist for changes during 1992–1996. Long term balloon measurements from Boulder indicate a net increase of 1.0 ± 0.2 ppm over 16 to 26 km for 1980–2010, but these long-term increases cannot be fully explained by changes in tropical tropopause temperatures, methane oxidation or other known factors.