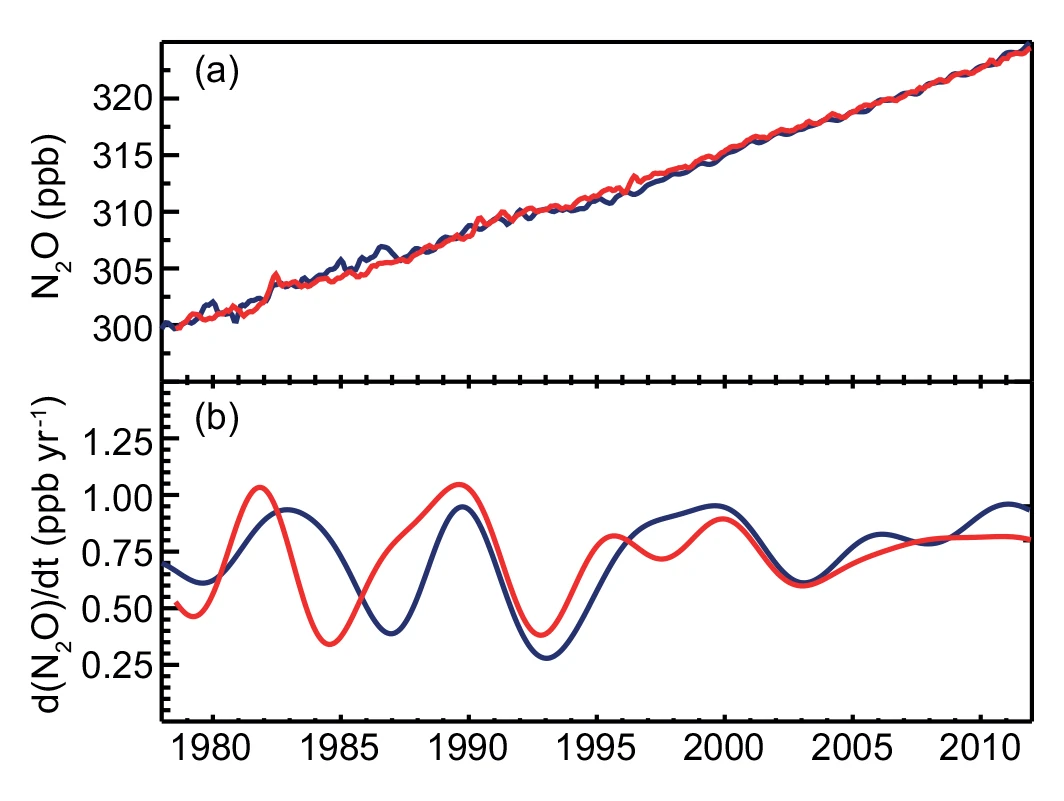
Figure 2.3 (a) Globally averaged N₂O dry-air mole fractions from AGAGE (red) and NOAA/ESRL/GMD (blue) at monthly resolution. (b) Instantaneous growth rates for globally averaged atmospheric N₂O. Growth rates were calculated as in Figure 2.1.
Globally averaged N₂O in 2011 was 324.2 ppb, an increase of 5.0 ppb over the value reported for 2005 in AR4 (Table 2.1). This is an increase of 20% over the estimate for 1750 from ice cores, 270 ± 7 ppb (Prather et al., 2012). Measurements of N₂O and its isotopic composition in firn air suggest the increase, at least since the early 1950s, is dominated by emissions from soils treated with synthetic and organic (manure) nitrogen fertilizer (Rockmann and Levin, 2005; Ishijima et al., 2007; Davidson, 2009; Syakila and Kroeze, 2011). Since systematic measurements began in the late 1970s, N₂O has increased at an average rate of ~0.75 ppb/yr (Figure 2.3). Because the atmospheric burden of CFC-12 is decreasing, N₂O has replaced CFC-12 as the third most important well-mixed GHG contributing to RF (Elkins and Dutton, 2011).
Persistent latitudinal gradients in annually averaged N₂O are observed at background surface sites, with maxima in the northern subtropics, values about 1.7 ppb lower in the Antarctic, and values about 0.4 ppb lower in the Arctic (Huang et al., 2008). These persistent gradients contain information about anthropogenic emissions from fertilizer use at northern tropical to mid-latitudes and natural emissions from soils and ocean upwelling regions of the tropics. N₂O time series also contain seasonal variations with peak-to-peak amplitudes of about 1 ppb in high latitudes of the NH and about 0.4 ppb at high southern and tropical latitudes. In the NH, exchange of air between the stratosphere (where N₂O is destroyed by photochemical processes) and troposphere is the dominant contributor to observed seasonal cycles, not seasonality in emissions (Jiang et al., 2007). Nevison et al. (2011) found correlations between the magnitude of detrended N₂O seasonal minima and lower stratospheric temperature, providing evidence for a stratospheric influence on the timing and amplitude of the seasonal cycle at surface monitoring sites. In the Southern Hemisphere (SH), observed seasonal cycles are also affected by stratospheric influx, and by ventilation and thermal out-gassing of N₂O from the oceans.