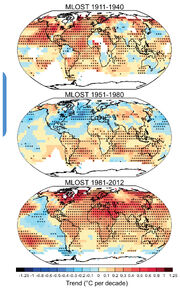
Figure 2.22 Trends in surface temperature from NCDC MLOST for three nonconsectutive shorter periods (1911–1940; 1951–1980; 1981–2012). White areas indicate incomplete or missing data. Trends and significance have been calculated as in Figure 2.21.

Figure 2.24 Global annual average lower stratospheric (top) and lower tropospheric (bottom) temperature anomalies relative to a 1981–2010 climatology from different data sets. STAR does not produce a lower tropospheric temperature product. Note that the y-axis resolution differs between the two panels.

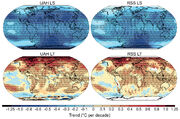
Figure 2.25 Trends in MSU upper air temperature over 1979–2012 from UAH (left-hand panels) and RSS (right-hand panels) and for LS (top row) and LT (bottom row). Data are temporally complete within the sampled domains for each data set. White areas indicate incomplete or missing data. Black plus signs (+) indicate grid boxes where trends are significant (i.e., a trend of zero lies outside the 90% confidence interval).

Figure 2.26 Trends in upper air temperature for all available radiosonde data products that contain records for 1958–2012 for the globe (top) and tropics (20°N to 20°S) and extra-tropics (bottom). The bottom panel trace in each case is for trends on distinct pressure levels. Note that the pressure axis is not linear. The top panel points show MSU layer equivalent measure trends. MSU layer equivalents have been processed using the method of Thorne et al. (2005). No attempts have been made to sub-sample to a common data mask.

Figure 2.27 As Figure 2.26 except for the satellite era 1979–2012 period and including MSU products (RSS, STAR and UAH).
Global-mean lower tropospheric temperatures have increased since the mid-20th century (Figure 2.24, bottom). Structural uncertainties (Box 2.1) are larger than at the surface but it can still be concluded that globally the troposphere has warmed (Table 2.8). On top of this long-term trend are superimposed short-term variations that are highly correlated with those at the surface but of somewhat greater amplitude. Global mean lower stratospheric temperatures have decreased since the mid- 20th century punctuated by short-lived warming events associated with explosive volcanic activity (Figure 2.24a). However, since the mid-1990s little net change has occurred. Cooling rates are on average greater from radiosonde data sets than MSU data sets. This very likely relates to widely recognized cooling biases in radiosondes (Mears et al., 2006) which all data set producers explicitly caution are likely to remain to some extent in their final products (Free and Seidel, 2007; Haimberger et al., 2008; Sherwood et al., 2008; Thorne et al., 2011).
In comparison to the surface (Figure 2.22), tropospheric layers exhibit smoother geographic trends (Figure 2.25) with warming dominating cooling north of approximately 45°S and greatest warming in high northern latitudes. The lower stratosphere cooled almost everywhere but this cooling exhibits substantial large-scale structure. Cooling is greatest in the highest southern latitudes and smallest in high northern latitudes. There are also secondary stratospheric cooling maxima in the mid-latitude regions of each hemisphere.
Available global and regional trends from radiosondes since 1958 (Figure 2.26) show agreement that the troposphere has warmed and the stratosphere cooled. While there is little ambiguity in the sign of the changes, the rate and vertical structure of change are distinctly data set dependent, particularly in the stratosphere. Differences are greatest in the tropics and SH extra-tropics where the historical radiosonde data coverage is poorest. Not shown in the figure for clarity are estimates of parametric data set uncertainties or trend-fit uncertainties — both of which are of the order of at least 0.1°C per decade (Section 2.4.4.1).
Differences in trends between available radiosonde data sets are greater during the satellite era than for the full radiosonde period of record in all regions and at most levels (Figure 2.27; cf. Figure 2.26). The RAOBCORE product exhibits greater vertical trend gradients than other data sets and it has been posited that this relates to its dependency on reanalysis fields (Sakamoto and Christy, 2009; Christy et al., 2010). MSU trend estimates in the troposphere are generally bracketed by the radiosonde range. In the stratosphere MSU deep layer estimates tend to show slightly less cooling. Over both 1958–2011 and 1979–2011 there is some evidence in the radiosonde products taken as a whole that the tropical tropospheric trends increase with height. But the magnitude and the structure is highly data set dependent.