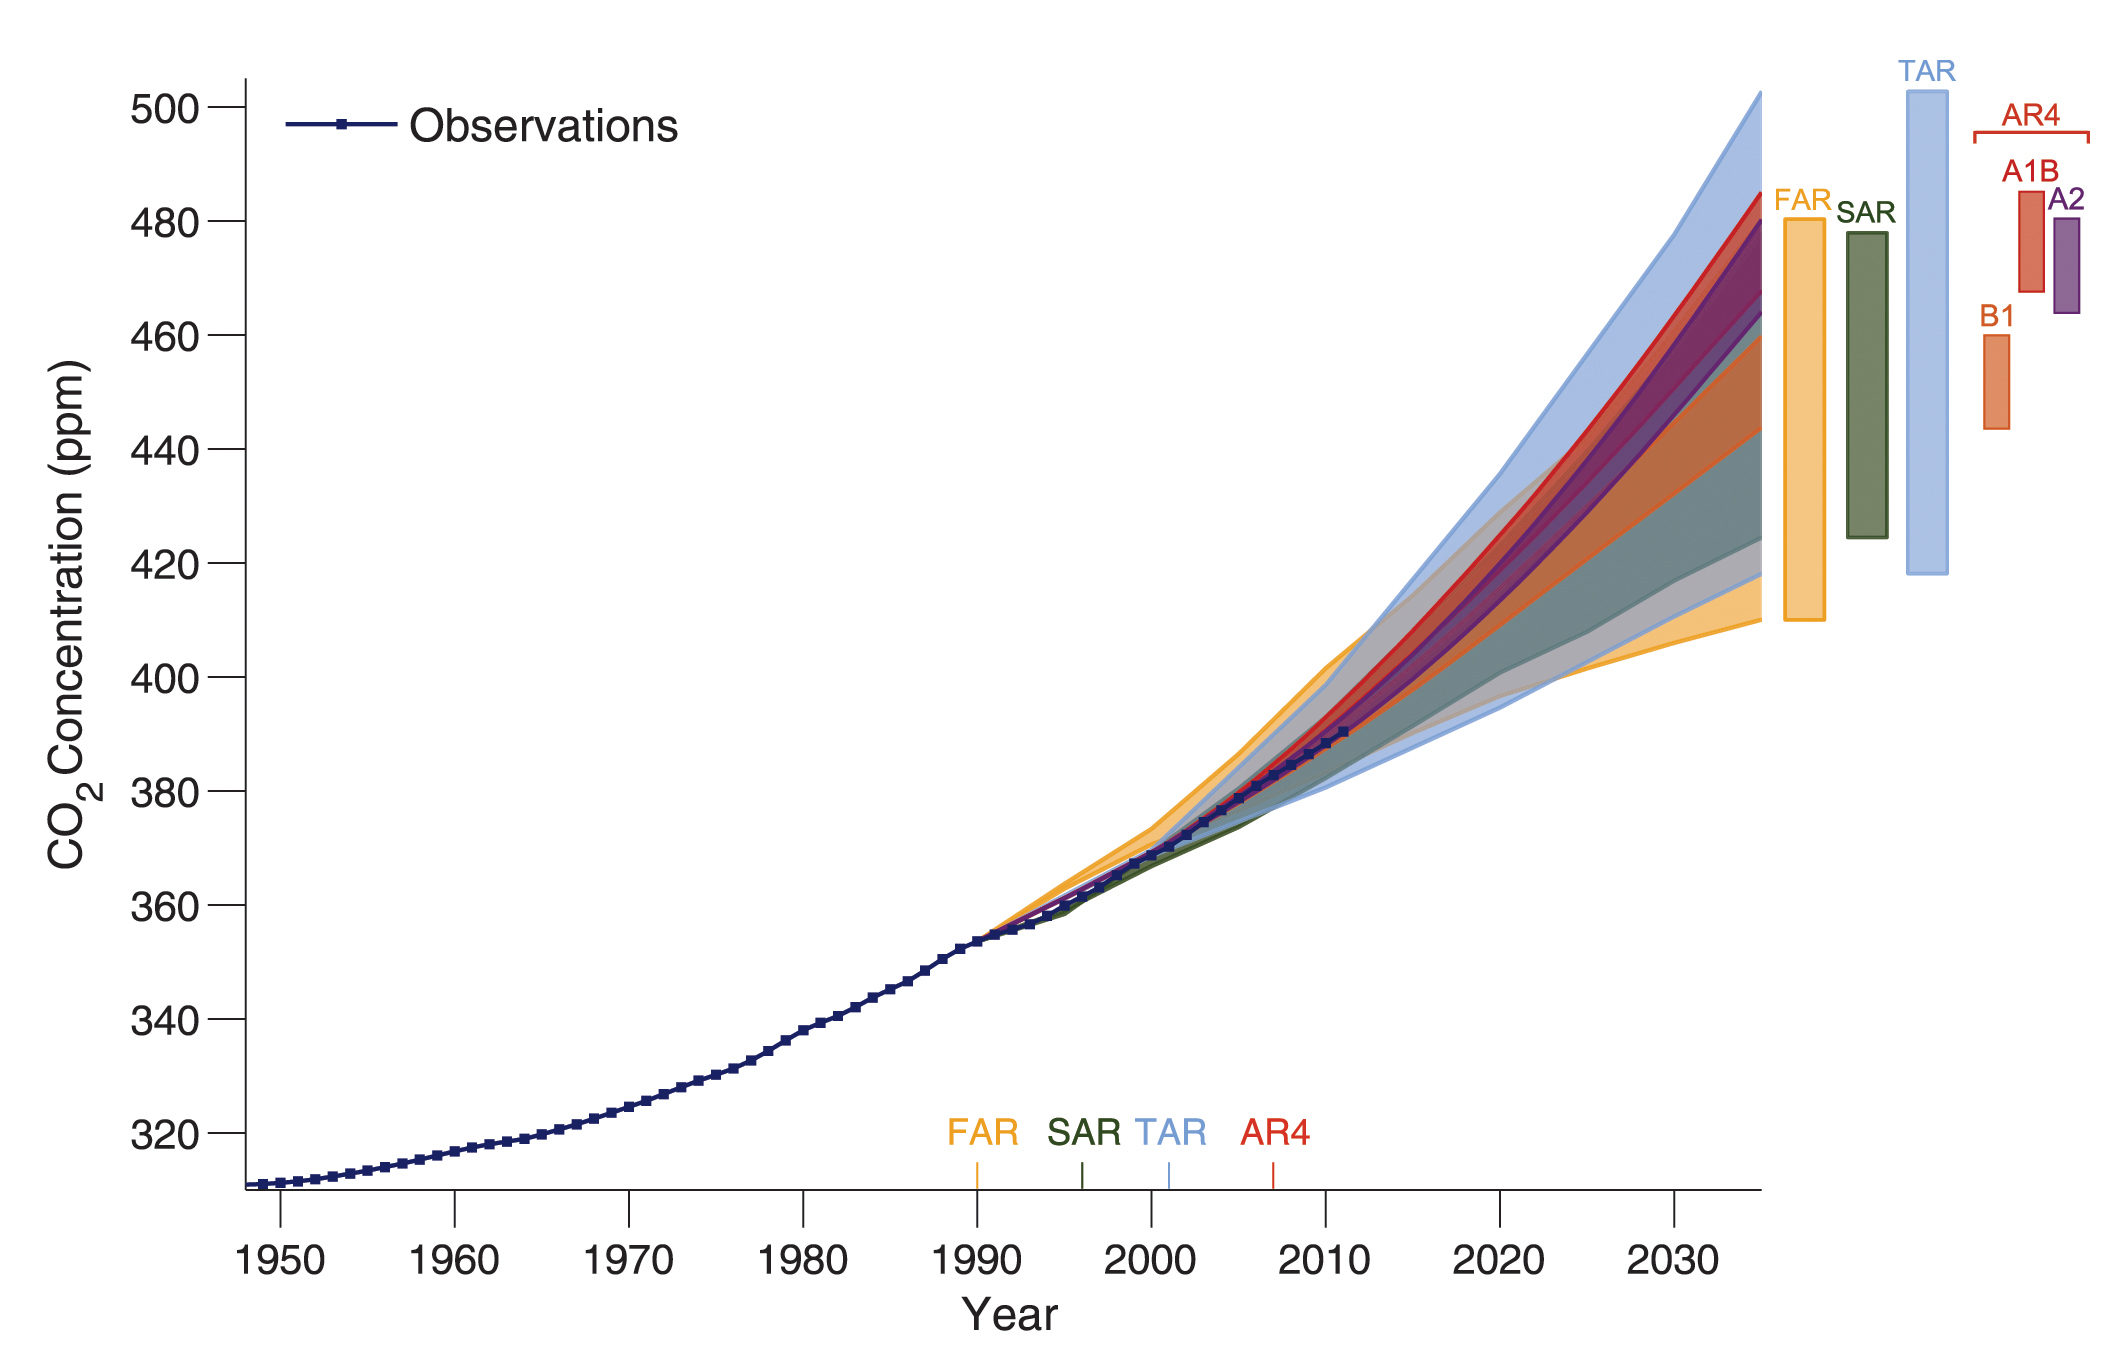
Figure 1.5 Observed globally and annually averaged CO₂ concentrations in parts per million (ppm) since 1950 compared with projections from the previous IPCC assessments. Observed global annual CO₂ concentrations are shown in dark blue. The shading shows the largest model projected range of global annual CO₂ concentrations from 1950 to 2035 from FAR (Figure A.3 in the Summary for Policymakers of IPCC, 1990); SAR (Figure 5b in the Technical Summary of IPCC, 1996); TAR (Appendix II of IPCC, 2001); and from the A2, A1B and B1 scenarios presented in the AR4 (Figure 10.26 in Meehl et al., 2007). The bars at the right-hand side of the graph show the full range given for 2035 for each assessment report. The publication years of the assessment reports are shown. See Appendix 1.A for details on the data and calculations used to create this figure.
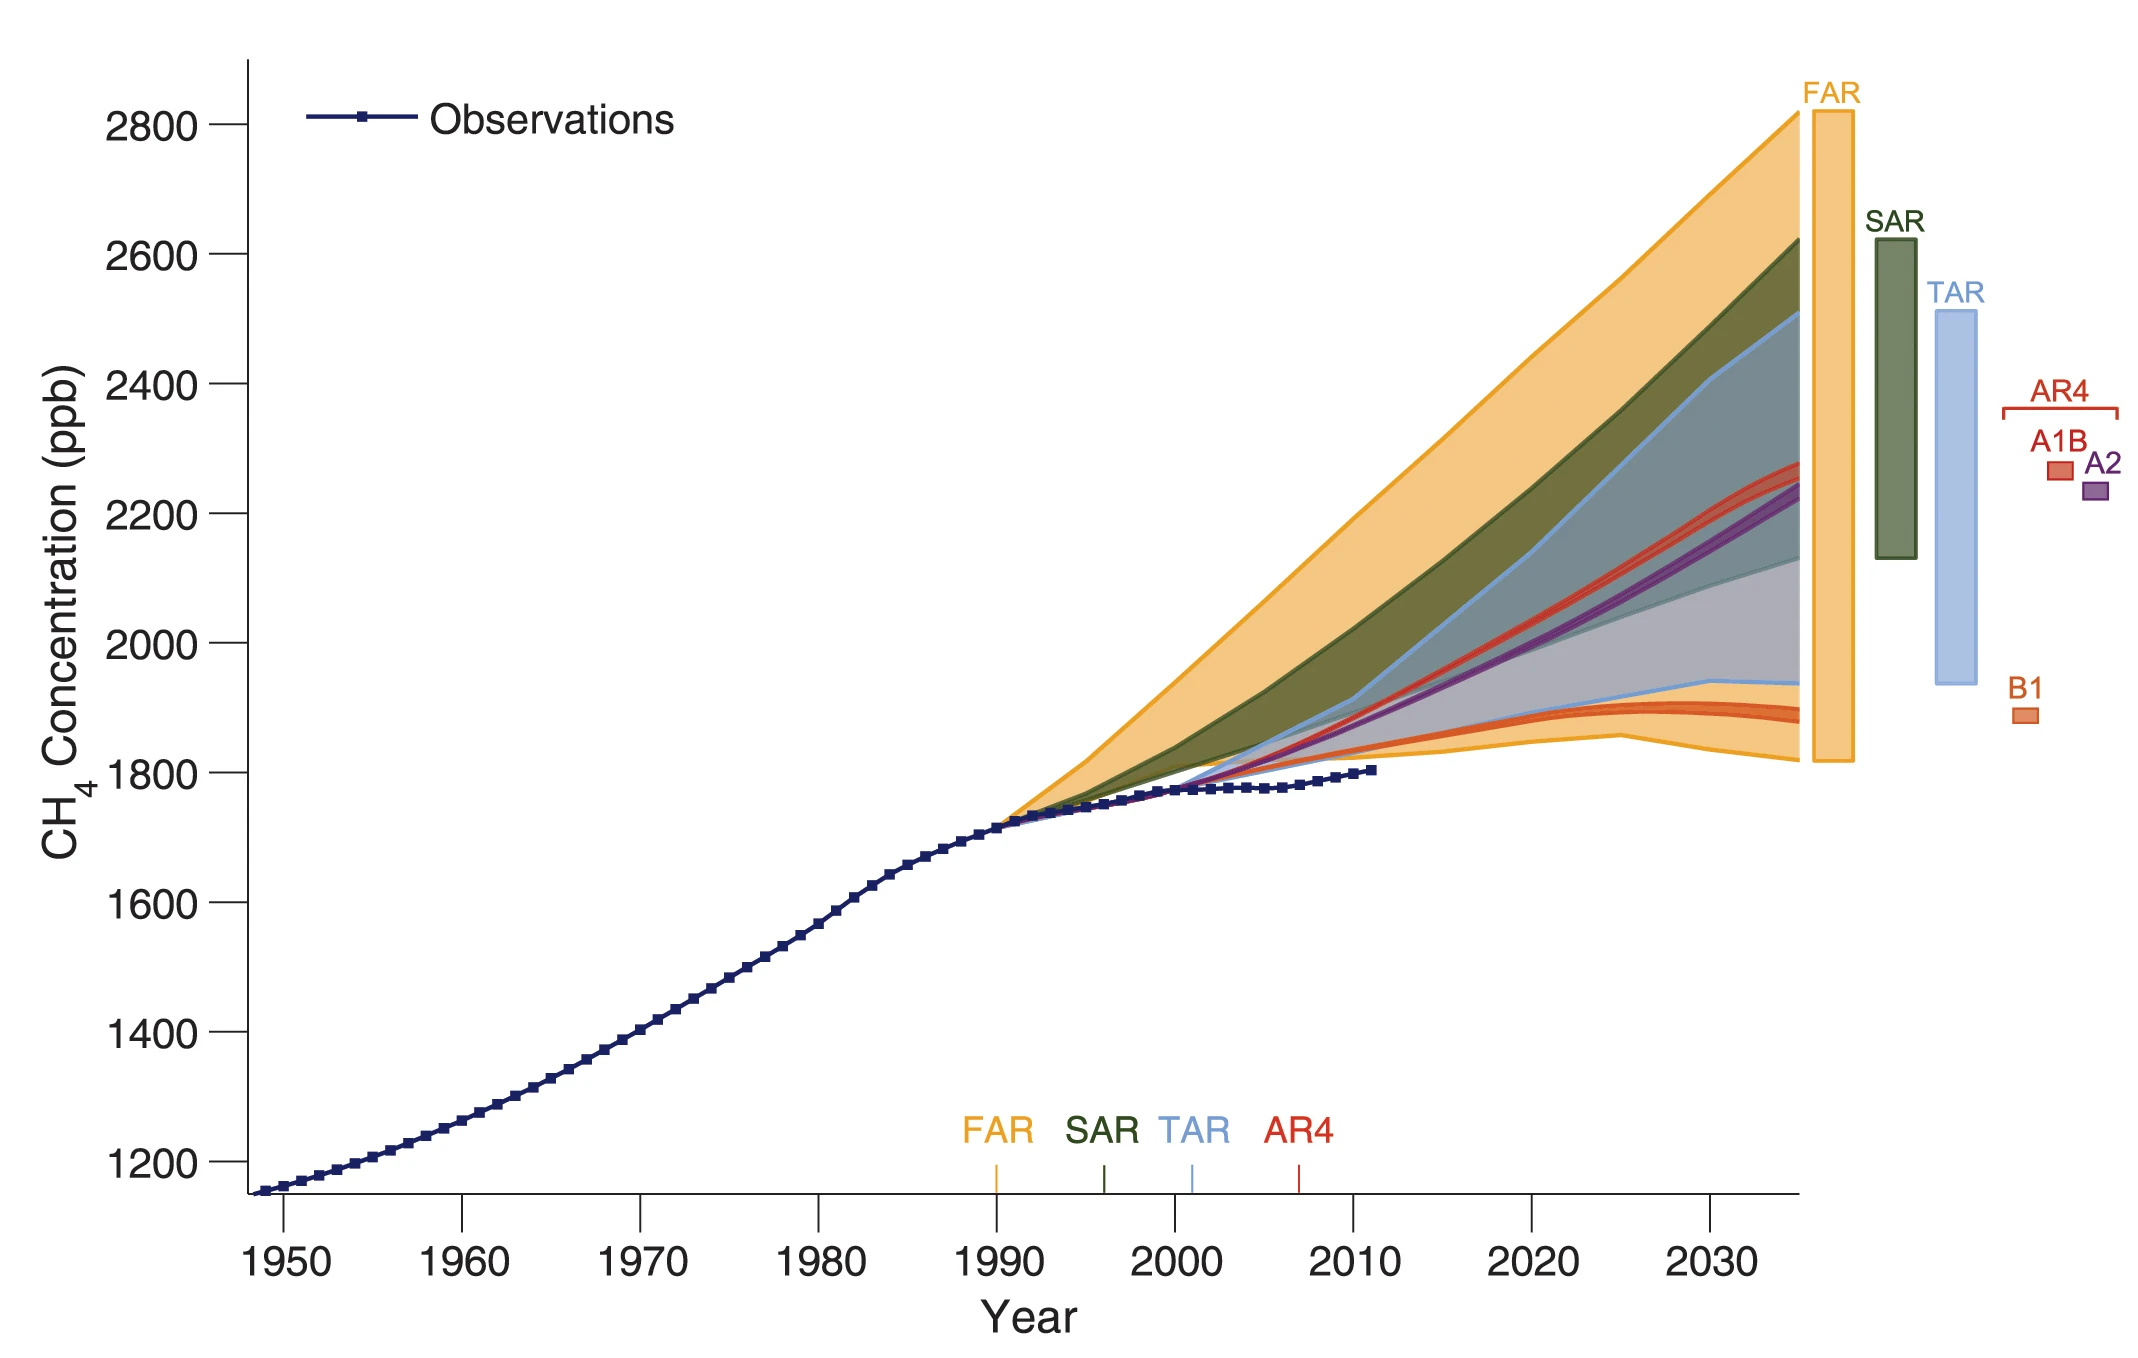
Figure 1.6 Observed globally and annually averaged CH4 concentrations in parts per billion (ppb) since 1950 compared with projections from the previous IPCC assessments. Estimated observed global annual CH4 concentrations are shown in dark blue. The shading shows the largest model projected range of global annual CH4 concentrations from 1950 to 2035 from FAR (Figure A.3 of the Annex of IPCC, 1990); SAR (Table 2.5a in Schimel et al., 1996); TAR (Appendix II of IPCC, 2001); and from the A2, A1B and B1 scenarios presented in the AR4 (Figure 10.26 in Meehl et al., 2007).[1] The bars at the right-hand side of the graph show the full range given for 2035 for each assessment report. The publication years of the assessment reports are shown. See Appendix 1.A for details on the data and calculations used to create this figure.

Figure 1.7 Observed globally and annually averaged N₂O concentrations in parts per billion (ppb) since 1950 compared with projections from the previous IPCC assessments. Observed global annual N₂O concentrations are shown in dark blue. The shading shows the largest model projected range of global annual N₂O concentrations from 1950 to 2035 from FAR (Figure A3 in the Annex of IPCC, 1990), SAR (Table 2.5b in Schimel et al., 1996),[2] TAR (Appendix II of IPCC, 2001), and from the A2, A1B and B1 scenarios presented in the AR4 (Figure 10.26 in Meehl et al., 2007).[1] The bars at the right hand side of the graph show the full range given for 2035 for each assessment report. The publication years of the assessment reports are shown. See Appendix 1.A for details on the data and calculations used to create this figure.
Key indicators of global climate change also include the changing concentrations of the radiatively important GHGs that are significant drivers for this change (e.g., Denman et al., 2007;[3] Forster et al., 2007).[4] Figures 1.5 through 1.7 show the recent globally and annually averaged observed concentrations for the gases of most concern, CO₂, CH4, and N₂O (see Sections 2.2, 6.3 and 8.3 for more detailed discussion of these and other key gases). As discussed in the later chapters, accurate measurements of these long-lived gases come from a number of monitoring stations throughout the world. The observations in these figures are compared with the projections from the previous IPCC assessments.
The model simulations begin with historical emissions up to 1990. The further evolution of these gases was described by scenario projections. TAR and AR4 model concentrations after 1990 are based on the SRES scenarios but those model results may also account for historical emissions analyses. The recent observed trends in CO₂ concentrations tend to be in the middle of the scenarios used for the projections (Figure 1.5).
As discussed in Dlugokencky et al. (2009),[5] trends in CH4 showed a stabilization from 1999 to 2006, but CH4 concentrations have been increasing again starting in 2007 (see Sections 2.2 and 6.3 for more discussion on the budget and changing concentration trends for CH4). Because at the time the scenarios were developed (e.g., the SRES scenarios were developed in 2000), it was thought that past trends would continue, the scenarios used and the resulting model projections assumed in FAR through AR4 all show larger increases than those observed (Figure 1.6).
Concentrations of N₂O have continued to increase at a nearly constant rate (Elkins and Dutton, 2010)[6] since about 1970 as shown in Figure 1.7. The observed trends tend to be in the lower part of the projections for the previous assessments.
Notes[]
- ↑ 1.0 1.1 Meehl, G. A., et al., 2007: Global climate projections. In: Climate Change 2007: The Physical Science Basis. Contribution of Working Group I to the Fourth Assessment Report of the Intergovernmental Panel on Climate Change [Solomon, S., D. Qin, M. Manning, Z. Chen, M. Marquis, K. B. Averyt, M. Tignor and H. L. Miller (eds.)]. Cambridge University Press, Cambridge, United Kingdom and New York, NY, USA, 749–845.
- ↑ Schimel, D., et al., 1996: Radiative forcing of climate change. In: Climate Change 1995: The Science of Climate Change, Contribution of Working Group I to the Second Assessment Report of the Intergovernmental Panel on Climate Change [J. T. Houghton, L. G. Meiro Filho, B. A. Callander, N. Harris, A. Kattenburg and K. Maskell (eds.)]. Cambridge University Press, Cambridge, United Kingdom and New York, NY, USA, 69–131.
- ↑ Denman, K. L., et al., 2007: Couplings between changes in the climate system and biogeochemistry. In: Climate Change 2007: [ The Physical Science Basis]. Contribution of Working Group I to the Fourth Assessment Report of the Intergovernmental Panel on Climate Change [Solomon, S., D. Qin, M. Manning, Z. Chen, M. Marquis, K. B. Averyt, M. Tignor and H. L. Miller (eds.)]. Cambridge University Press, Cambridge, United Kingdom and New York, NY, USA, 501–587.
- ↑ Forster, P., et al., 2007: Changes in atmospheric constituents and in radiative forcing. In: Climate Change 2007: [ The Physical Science Basis]. Contribution of Working Group I to the Fourth Assessment Report of the Intergovernmental Panel on Climate Change [Solomon, S., D. Qin, M. Manning, Z. Chen, M. Marquis, K. B. Averyt, M. Tignor and H. L. Miller (eds.)]. Cambridge University Press, Cambridge, United Kingdom and New York, NY, USA, 131–234.
- ↑ Dlugokencky, E. J., et al., 2009: Observational constraints on recent increases in the atmospheric CH4 burden. Geophys. Res. Lett., 36, L18803.
- ↑ Elkins, J., and G. Dutton, 2010: Nitrous oxide and sulfur hexaflouride. Section in State of the Climate in 2009. Bull. Am. Meteorol. Soc., 91, 44–45.
ES 1.1 1.2.1 1.2.2 1.2.3 1.3 1.3.1 1.3.2 1.3.3 1.3.4 1.3.4.1 1.3.4.2 1.3.4.3 1.4.1 1.4.2 1.4.3 1.4.4 1.5 1.5.1 1.5.2 1.6 Box 1 FAQ Refs