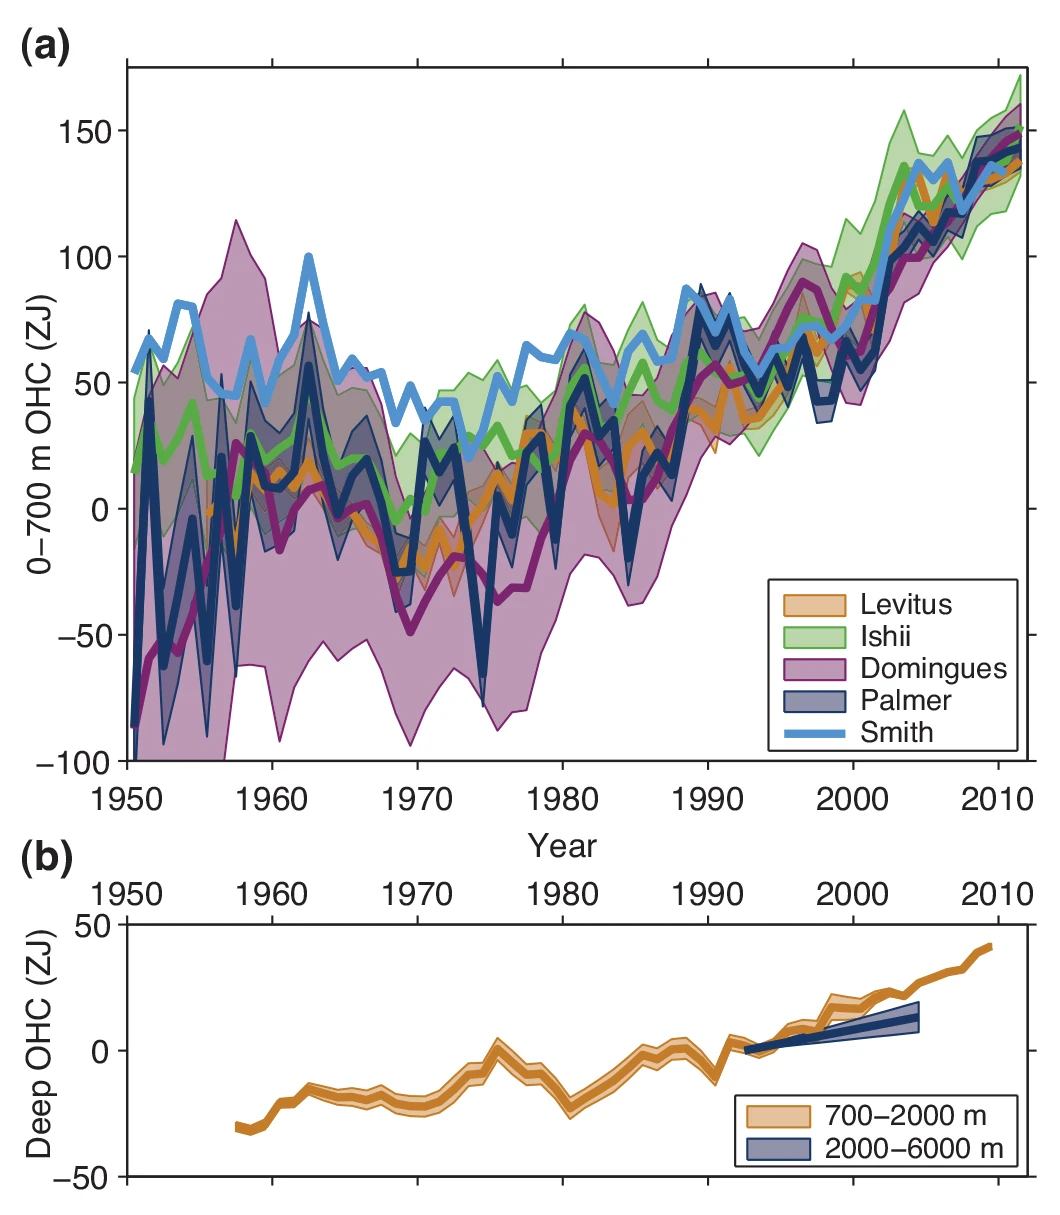
Figure 3.2 (a) Observation-based estimates of annual global mean upper (0 to 700 m) ocean heat content in ZJ (1 ZJ = 1021 Joules) updated from (see legend): Levitus et al. (2012), Ishii and Kimoto (2009), Domingues et al. (2008), Palmer et al. (2007) and Smith and Murphy (2007). Uncertainties are shaded and plotted as published (at the one standard error level, except one standard deviation for Levitus, with no uncertainties provided for Smith). Estimates are shifted to align for 2006–2010, 5 years that are well measured by Argo, and then plotted relative to the resulting mean of all curves for 1971, the starting year for trend calculations. (b) Observation-based estimates of annual 5-year running mean global mean mid-depth (700 to 2000 m) ocean heat content in ZJ (Levitus et al., 2012) and the deep (2000 to 6000 m) global ocean heat content trend from 1992 to 2005 (Purkey and Johnson, 2010), both with one standard error uncertainties shaded (see legend).
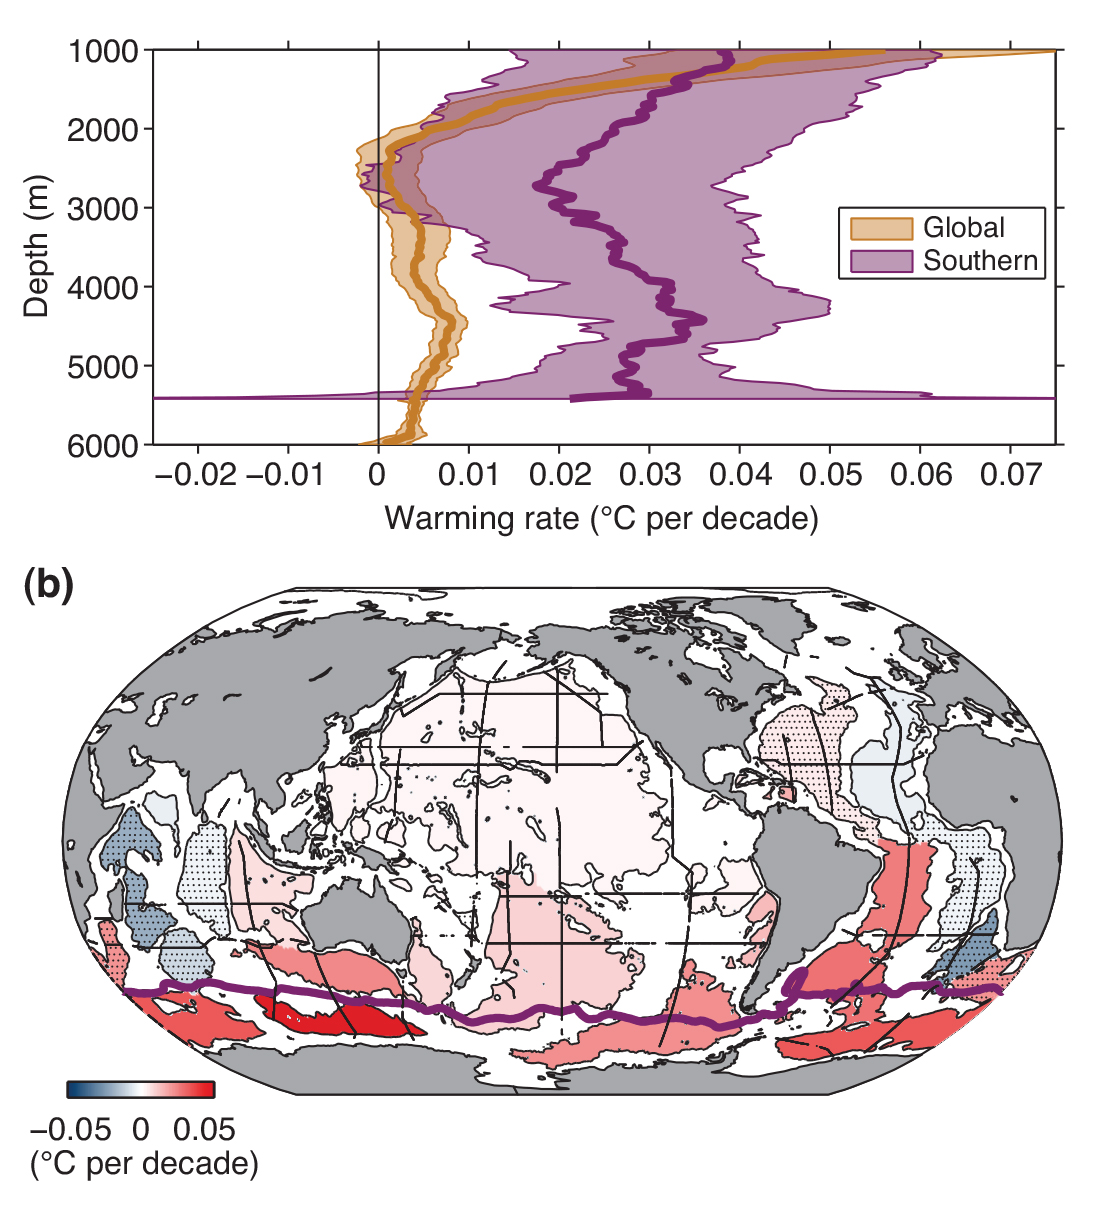
Figure 3.3 (a) Areal mean warming rates (ºC per decade) versus depth (thick lines) with 5 to 95% confidence limits (shading), both global (orange) and south of the Sub-Antarctic Front (purple), centred on 1992–2005. (b) Mean warming rates (ºC per decade) below 4000 m (colour bar) estimated for deep ocean basins (thin black outlines), centred on 1992–2005. Stippled basin warming rates are not significantly different from zero at 95% confidence. The positions of the Sub-Antarctic Front (purple line) and the repeat oceanographic transects from which these warming rates are estimated (thick black lines) also shown. (Data from Purkey and Johnson, 2010.)
Below 700 m data coverage is too sparse to produce annual global ocean heat content estimates prior to about 2005, but from 2005 to 2010 and 0 to 1500 m the global ocean warmed (von Schuckmann and Le Traon, 2011). Five-year running mean estimates yield a 700 to 2000 m global ocean heat content trend from 1957 to 2009 (Figure 3.2b) that is about 30% of that for 0 to 2000 m over the length of the record (Levitus et al., 2012). Ocean heat uptake from 700 to 2000 m likely continues unabated since 2003 (Figure 3.2b); as a result, ocean heat content from 0 to 2000 m shows less slowing after 2003 than does 0 to 700 m heat content (Levitus et al., 2012).
Global sampling of the ocean below 2000 m is limited to a number of repeat oceanographic transects, many occupied only in the last few decades (Figure 3.3b), and several time-series stations, some of which extend over decades. This sparse sampling in space and time makes assessment of global deep ocean heat content variability less certain than that for the upper ocean (Ponte, 2012), especially at middepths, where vertical gradients are still sufficiently large for transient variations (ocean eddies, internal waves, and internal tides) to alias estimates made from sparse data sets. However, the deep North Atlantic Ocean is better sampled than the rest of the globe, making estimates of full-depth deep ocean heat content changes there feasible north of 20ºN since the mid-1950s (Mauritzen et al., 2012).
Based on the limited information available, it is likely that the global ocean did not show a significant temperature trend between 2000 and 3000 m depth from about 1992–2005 (Figures 3.2b and 3.3a; Kouketsu et al., 2011). At these depths it has been around a millennium on average since waters in the Indian and Pacific Oceans were last exposed to air–sea interaction (Gebbie and Huybers, 2012).
Warming from 1992 to 2005 is likely greater than zero from 3000 m to the ocean floor (Figures 3.2b and 3.3a; Kouketsu et al., 2011), especially in recently formed Antarctic Bottom Water (AABW). South of the Sub-Antarctic Front (Figure 3.3b), much of the water column warmed between 1992 and 2005 (Purkey and Johnson, 2010). Globally, deep warming rates are highest near 4500 m (Figure 3.3a), usually near the sea floor where the AABW influence is strongest, and attenuate towards the north (Figure 3.3b), where the AABW influence weakens. Global scale abyssal warming on relatively short multi-decadal time scales is possible because of communication of signals by planetary waves originating within the Southern Ocean, reaching even such remote regions as the North Pacific (Kawano et al., 2010; Masuda et al., 2010). This AABW warming may partly reflect a recovery from cool conditions induced by the 1970s Weddell Sea Polynya (Robertson et al., 2002), but further north, in the Vema Channel of the South Atlantic, observations since 1970 suggest strong bottom water warming did not commence there until about 1991 (Zenk and Morozov, 2007).