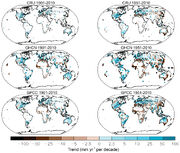
Figure 2.29 Trends in annual precipitation over land from the CRU, GHCN and GPCC data sets for 1901–2010 (left-hand panels) and 1951–2010 (right-hand panels). Trends have been calculated only for those grid boxes with greater than 70% complete records and more than 20% data availability in first and last decile of the period. White areas indicate incomplete or missing data. Black plus signs (+) indicate grid boxes where trends are significant (i.e., a trend of zero lies outside the 90% confidence interval).

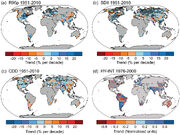
Figure 2.33 Trends in (a) annual amount of precipitation from days >95th percentile (R95p), (b) daily precipitation intensity (SDII) and (c) frequency of the annual maximum number of consecutive dry days (CDD) (Box 2.4, Table 1). Trends are shown as relative values for better comparison across different climatic regions. Trends were calculated only for grid boxes that had at least 40 years of data during this period and where data ended no earlier than 2003. Grey areas indicate incomplete or missing data. Black plus signs (+) indicate grid boxes where trends are significant (i.e., a trend of zero lies outside the 90% confidence interval). The data source for trend maps is HadEX2 (Donat et al., 2013a) updated to include the latest version of the European Climate Assessment data set (Klok and Tank, 2009). (d) Trends (normalized units) in hydroclimatic intensity (HY-INT: a multiplicative measure of length of dry spell and precipitation intensity) over the period 1976–2000 (adapted from Giorgi et al., 2011). An increase (decrease) in HY-INT reflects an increase (decrease) in the length of drought and /or extreme precipitation events.
AR4 concluded that droughts had become more common, especially in the tropics and sub-tropics since about 1970. SREX provided a comprehensive assessment of changes in observed droughts (Section 3.5.1 and Box 3.3 of SREX), updated the conclusions provided by AR4 and stated that the type of drought considered and the complexities in defining drought (Annex III: Glossary) can substantially affect the conclusions regarding trends on a global scale (Chapter 10). Based on evidence since AR4, SREX concluded that there were not enough direct observations of dryness to suggest high confidence in observed trends globally, although there was medium confidence that since the 1950s some regions of the world have experienced more intense and longer droughts. The differences between AR4 and SREX are due primarily to analyses post-AR4, differences in how both assessments considered drought and updated IPCC uncertainty guidance.
There are very few direct measurements of drought related variables, such as soil moisture (Robock et al., 2000), so drought proxies (e.g., PDSI, SPI, SPEI; Box 2.4) and hydrological drought proxies (e.g., Vidal et al., 2010; Dai, 2011b) are often used to assess drought. The chosen proxy (e.g., precipitation, evapotranspiration, soil moisture or streamflow) and time scale can strongly affect the ranking of drought events (Sheffield et al., 2009; Vidal et al., 2010). Analyses of these indirect indices come with substantial uncertainties. For example, PDSI may not be comparable across climate zones. A self-calibrating (sc-) PDSI can replace the fixed empirical constants in PDSI with values representative of the local climate (Wells et al., 2004). Furthermore, for studies using simulated soil moisture, the type of potential evapotranspiration model used can lead to significant differences in the estimation of the regions affected and the areal extent of drought (Sheffield et al., 2012), but the overall effect of a more physically realistic parameterisation is debated (van der Schrier et al., 2013).
Because drought is a complex variable and can at best be incompletely represented by commonly used drought indices, discrepancies in the interpretation of changes can result. For example, Sheffield and Wood (2008) found decreasing trends in the duration, intensity and severity of drought globally. Conversely, Dai (2011a,b) found a general global increase in drought, although with substantial regional variation and individual events dominating trend signatures in some regions (e.g., the 1970s prolonged Sahel drought and the 1930s drought in the USA and Canadian Prairies). Studies subsequent to these continue to provide somewhat different conclusions on trends in global droughts and/ or dryness since the middle of the 20th century (Sheffield et al., 2012; Dai, 2013; Donat et al., 2013c; van der Schrier et al., 2013).
Van der Schrier et al. (2013), using monthly sc-PDSI, found no strong case either for notable drying or moisture increase on a global scale over the periods 1901–2009 or 1950–2009, and this largely agrees with the results of Sheffield et al. (2012) over the latter period. A comparison between the sc-PDSI calculated by van der Schrier et al. (2013) and that of Dai (2011a) shows that the dominant mode of variability is very similar, with a temporal evolution suggesting a trend toward drying. However, the same analysis for the 1950–2009 period shows an initial increase in drying in the Van der Schrier et al. data set, followed by a decrease from the mid-1980s onwards, while the Dai data show a continuing increase until 2000. The difference in trends between the sc-PDSI data set of Van der Schrier et al. and Dai appears to be due to the different calibration periods used, the shorter 1950–1979 period in the latter study resulting in higher index values from 1980 onwards, although the associated spatial patterns are similar. In addition, the observed precipitation forcing data set differs between studies, with van der Schrier et al. (2013) and Sheffield et al. (2012) using CRU TS 3.10.01 (updated from Mitchell and Jones, 2005). This data set uses fewer stations and has been wetter than some other precipitation products in the last couple of decades (Figure 2.29, Table 2.9), although the best data set to use is still an open question. Despite this, a measure of sc-PDSI with potential evapotranspiration estimated using the Penman–Montieth equation shows an increase in the percentage of land area in drought since 1950 (Sheffield et al., 2012; Dai, 2013), while van der Schrier et al. (2013) also finds a slight increase in the percentage of land area in severe drought using the same measure. This is qualitatively consistent with the trends in surface soil moisture found for the shorter period 1988–2010 by Dorigo et al. (2012) using a new multi-satellite data set and changes in observed streamflow (Dai, 2011b). However all these studies draw somewhat different conclusions and the compelling arguments both for (Dai, 2011b, 2013) and against (Sheffield et al., 2012; van der Schrier et al., 2013) a significant increase in the land area experiencing drought has hampered global assessment.
Studies that support an increasing trend towards the land area affected by drought seem to be at odds with studies that look at trends in dryness (i.e., lack of rainfall). For example, Donat et al. (2013c) found that the annual maximum number of consecutive dry days has declined since the 1950s in more regions than it has increased (Figure 2.33c). However, only regions in Russia and the USA indicate significant changes and there is a lack of information for this index over large regions, especially Africa. Most other studies focussing on global dryness find similar results, with decadal variability dominating longer-term trends (Frich et al., 2002; Alexander et al., 2006; Donat et al., 2013a). However, Giorgi et al. (2011) indicate that ‘hydroclimatic intensity’ (Box 2.4, Chapter 7), a measure which combines both dry spell length and precipitation intensity, has increased over the latter part of the 20th century in response to a warming climate. They show that positive trends (reflecting an increase in the length of drought and/or extreme precipitation events) are most marked in Europe, India, parts of South America and East Asia although trends appear to have decreased (reflecting a decrease in the length of drought and/or extreme precipitation events) in Australia and northern South America (Figure 2.33c). Data availability, quality and length of record remain issues in drawing conclusions on a global scale, however.
Despite differences between the conclusions drawn by global studies, there are some areas in which they agree. Table 2.13 indicates that there is medium confidence of an increase in dryness or drought in East Asia with high confidence that this is the case in the Mediterannean and West Africa. There is also high confidence of decreases in dryness or drought in central North America and north-west Australia.
In summary, the current assessment concludes that there is not enough evidence at present to suggest more than low confidence in a global-scale observed trend in drought or dryness (lack of rainfall) since the middle of the 20th century, owing to lack of direct observations, geographical inconsistencies in the trends, and dependencies of inferred trends on the index choice. Based on updated studies, AR4 conclusions regarding global increasing trends in drought since the 1970s were probably overstated. However, it is likely that the frequency and intensity of drought has increased in the Mediterranean and West Africa and decreased in central North America and north-west Australia since 1950.