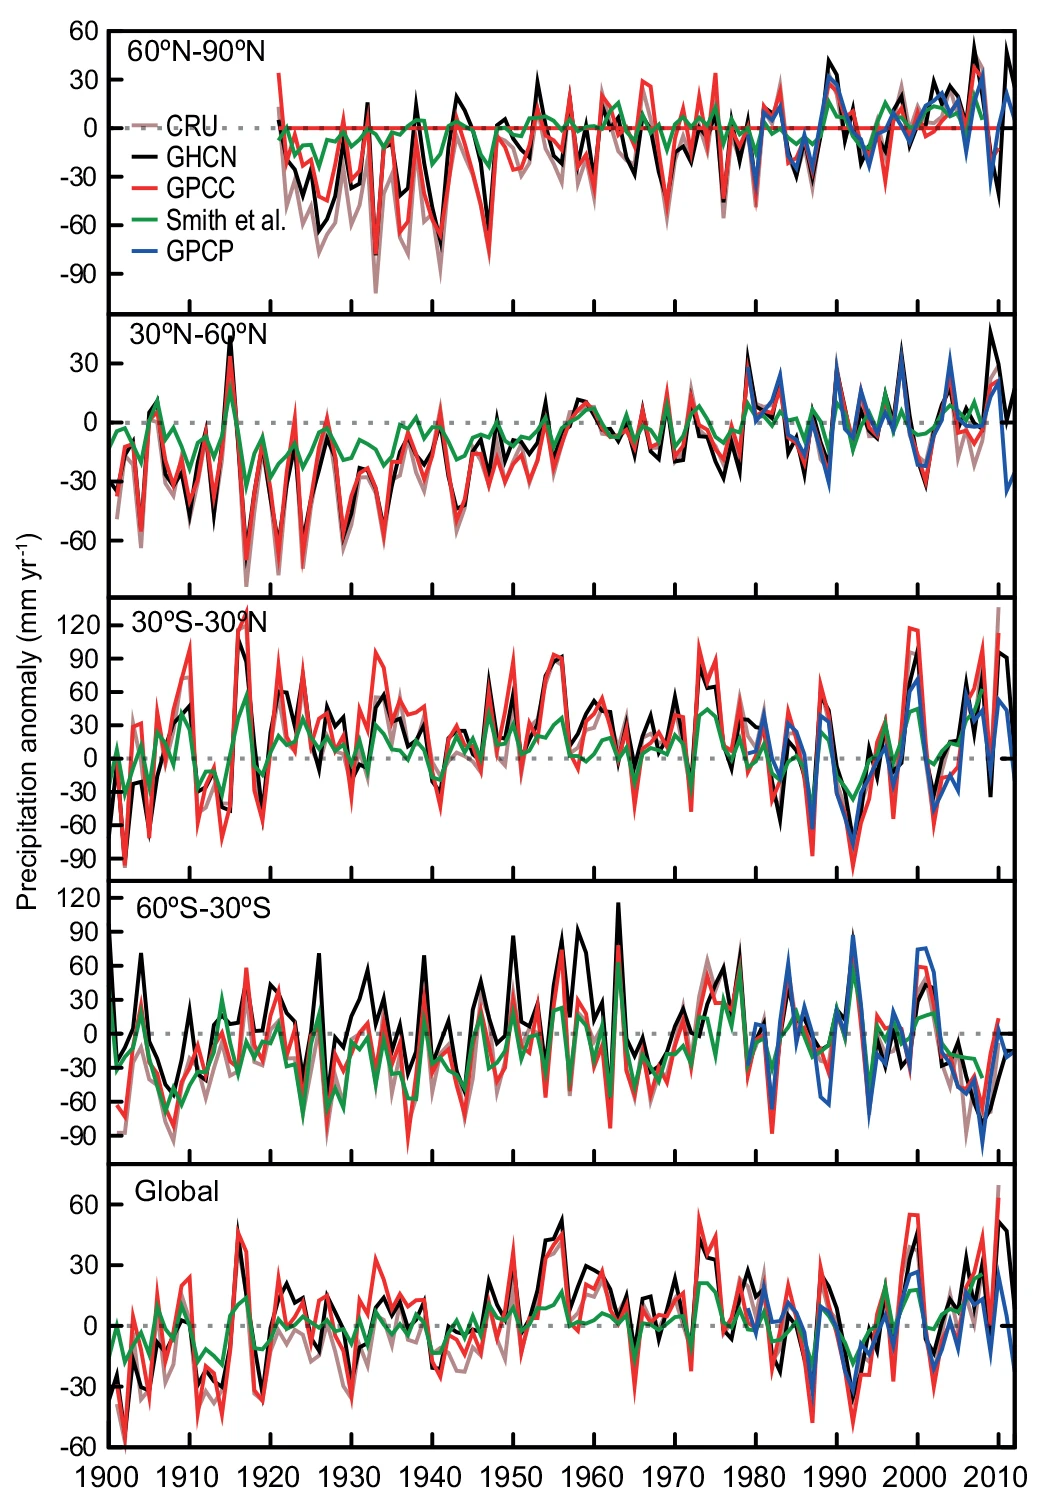
Figure 2.28 Annual precipitation anomalies averaged over land areas for four latitudinal bands and the globe from five global precipitation data sets relative to a 1981–2000 climatology.

Figure 2.29 Trends in annual precipitation over land from the CRU, GHCN and GPCC data sets for 1901–2010 (left-hand panels) and 1951–2010 (right-hand panels). Trends have been calculated only for those grid boxes with greater than 70% complete records and more than 20% data availability in first and last decile of the period. White areas indicate incomplete or missing data. Black plus signs (+) indicate grid boxes where trends are significant (i.e., a trend of zero lies outside the 90% confidence interval).
The latitude band plots in Figure 2.28 suggest that precipitation over
tropical land areas (30°S to 30°N) has increased over the last decade reversing the drying trend that occurred from the mid-1970s to mid- 1990s. As a result the period 1951–2008 shows no significant overall trend in tropical land precipitation in any of the datasets (Table 2.10). Longer term trends (1901–2008) in the tropics, shown in Table 2.10, are also non-significant for each of the four data sets. The mid-latitudes of the NH (30°N to 60°N) show an overall increase in precipitation from 1901 to 2008 with statistically significant trends for each data set. For the shorter period (1951–2008) the trends are also positive but non-significant for three of the four data sets. For the high latitudes of the NH (60°N to 90°N) where data completeness permits trend calculations solely for the 1951–2008 period, all datasets show increases but there is a wide range of magnitudes and the infilled Smith et al. series shows small and insignificant trends (Table 2.10). Fewer data from high latitude stations make these trends less certain and yield low confidence in resulting zonal band average estimates. In the mid-latitudes of the SH (60°S to 30°S) there is limited evidence of long-term increases with three data sets showing significant trends for the 1901–2008 period but GHCN having negative trends that are not significant. For the 1951–2008 period changes in SH mid-latitude precipitation are less certain, with one data set showing a significant trend towards drying, two showing non-significant drying trends and the final dataset suggesting increases in precipitation. All data sets show an abrupt decline in SH mid-latitude precipitation in the early 2000s (Figure 2.28) consistent with enhanced drying that has very recently recovered. These results for latitudinal changes are broadly consistent with the global satellite observations for the 1979–2008 period (Allan et al., 2010) and land-based gauge measurements for the 1950–1999 period (Zhang et al., 2007a).
In AR4, maps of observed trends of annual precipitation for 1901–2005 were calculated using GHCN interpolated to a 5° × 5° latitude/longitude grid. Trends (in percent per decade) were calculated for each grid box and showed statistically significant changes, particularly increases in eastern and northwestern North America, parts of Europe and Russia, southern South America and Australia, declines in the Sahel region of Africa, and a few scattered declines elsewhere.
Figure 2.29 shows the spatial variability of long-term trends (1901– 2010) and more recent trends (1951–2010) over land in annual precipitation using the CRU, GHCN and GPCC data sets. The trends are computed from land-only grid box time series using each native data set grid resolution. The patterns of these absolute trends (in mm yr–1 per decade) are broadly similar to the trends (in percent per decade) relative to local climatology (Supplementary Material 2.SM.6.1). Increases for the period 1901–2010 are seen in the mid- and higher-latitudes of both the NH and SH consistent with the reported changes for latitudinal bands. At the grid box scale, statistically significant trends occur in most of the same areas, in each data set but are far more limited than for temperature over a similar length period (cf. Figure 2.21). The GPCC map shows the most areas with significant trends. Comparing the maps in Figure 2.29, most areas for which trends can be calculated for both periods show similar trends between the 1901–2010 period and the 1951–2010 period with few exceptions (e.g., South Eastern Australia, ). Trends over shorter periods can differ from those implied for the longest periods. For example, since the late 1980s trends in the Sahel region have been significantly positive (not shown).
In summary, when averaged over the land areas of the mid-latitudes of the NH, all datasets show a likely overall increase in precipitation (medium confidence since 1901, but high confidence after 1951). For all other zones one or more of data sparsity, quality, or a lack of quantitative agreement amongst available estimates yields low confidence in characterisation of such long-term trends in zonally averaged precipitation. Nevertheless, changes in some more regional or shorter-term recent changes can be quantified. It is likely there was an abrupt decline in SH mid-latitude precipitation in the early 2000s consistent with enhanced drying that has very recently recovered. Precipitation in the tropical land areas has increased (medium confidence) over the last decade, reversing the drying trend that occurred from the mid-1970s to mid-1990s reported in AR4.